Skip to content
Accounting
Audit
Planning & Analysis
Process Solutions
Operations



Financial KPIs help CPG CFOs track margin, cash flow, inventory, trade spend, deductions, retailer performance, and working capital by SKU, channel, and customer.
Financial KPIs help CPG CFOs track margin, cash flow, inventory, trade spend, deductions, retailer performance, and working capital. Consumer packaged goods brands need these KPIs because sales growth can hide margin loss, cash pressure, inventory risk, and promotion losses.
In CPG, revenue growth is the easiest number to celebrate and the most dangerous one to trust. A brand can post record quarters, land new retailer doors, and still find itself thirty days before a cash crisis.
The P&L may look healthy, but is the bank balance telling a different story? Somewhere between the shelf and the deposit, the margin is slipping away, and the finance team cannot account for the difference.
That difference is why financial KPIs matter more in CPG than in any other industry.
Trade spend, retailer deductions, freight, co-packer terms, slow-moving SKUs, and long cash conversion cycles all compress margins in ways a top-line report will never reveal.
The right financial KPIs for CPG CFOs give visibility into margin, cash flow, inventory, trade spend, deductions, retailer performance, and working capital, broken down by SKU, channel, and customer. That level of detail is what lets leaders identify problems early.
This guide walks through:
Every business has a different ‘north star’ that largely depends on the industry it operates in. That’s why CPG CFOs need a KPI dashboard that is tailored to the industry.
Consumer packaged goods companies heavily rely on working capital, inventory movement, retailer deductions, trade promotions, SKU margins, cash timing, and channel performance.
A generic finance dashboard may only show revenue and expenses while a CPG CFO dashboard will break revenue by customers and channels. It will show the contribution margin by product-level, which is very important in identifying whether a product is profitable or not.
A CPG CFO should track revenue at the granular level due to the following reasons:
Increased promotions, discounts, and product mix shifts can reduce profitability.
Great marketing and strong distribution can sometimes accelerate your losses if the margin structure underneath is not right.
A high demand forecast can cause inventory to grow faster and may cause the company to be short on cash.
Slow-moving inventory locks up cash that could be used elsewhere, reducing working capital.
Small forecasting errors build over time, create inventory issues, and cash flow pressure. The consequences often don’t become visible until warehouses are packed with slow-moving products, for instance.
Rather than tracking dozens of disconnected metrics, CPG CFOs should organize KPIs into five core groups that provide a clear picture of business performance:
Revenue and margin KPIs show whether growth is profitable after COGS, discounts, deductions, and trade spend.
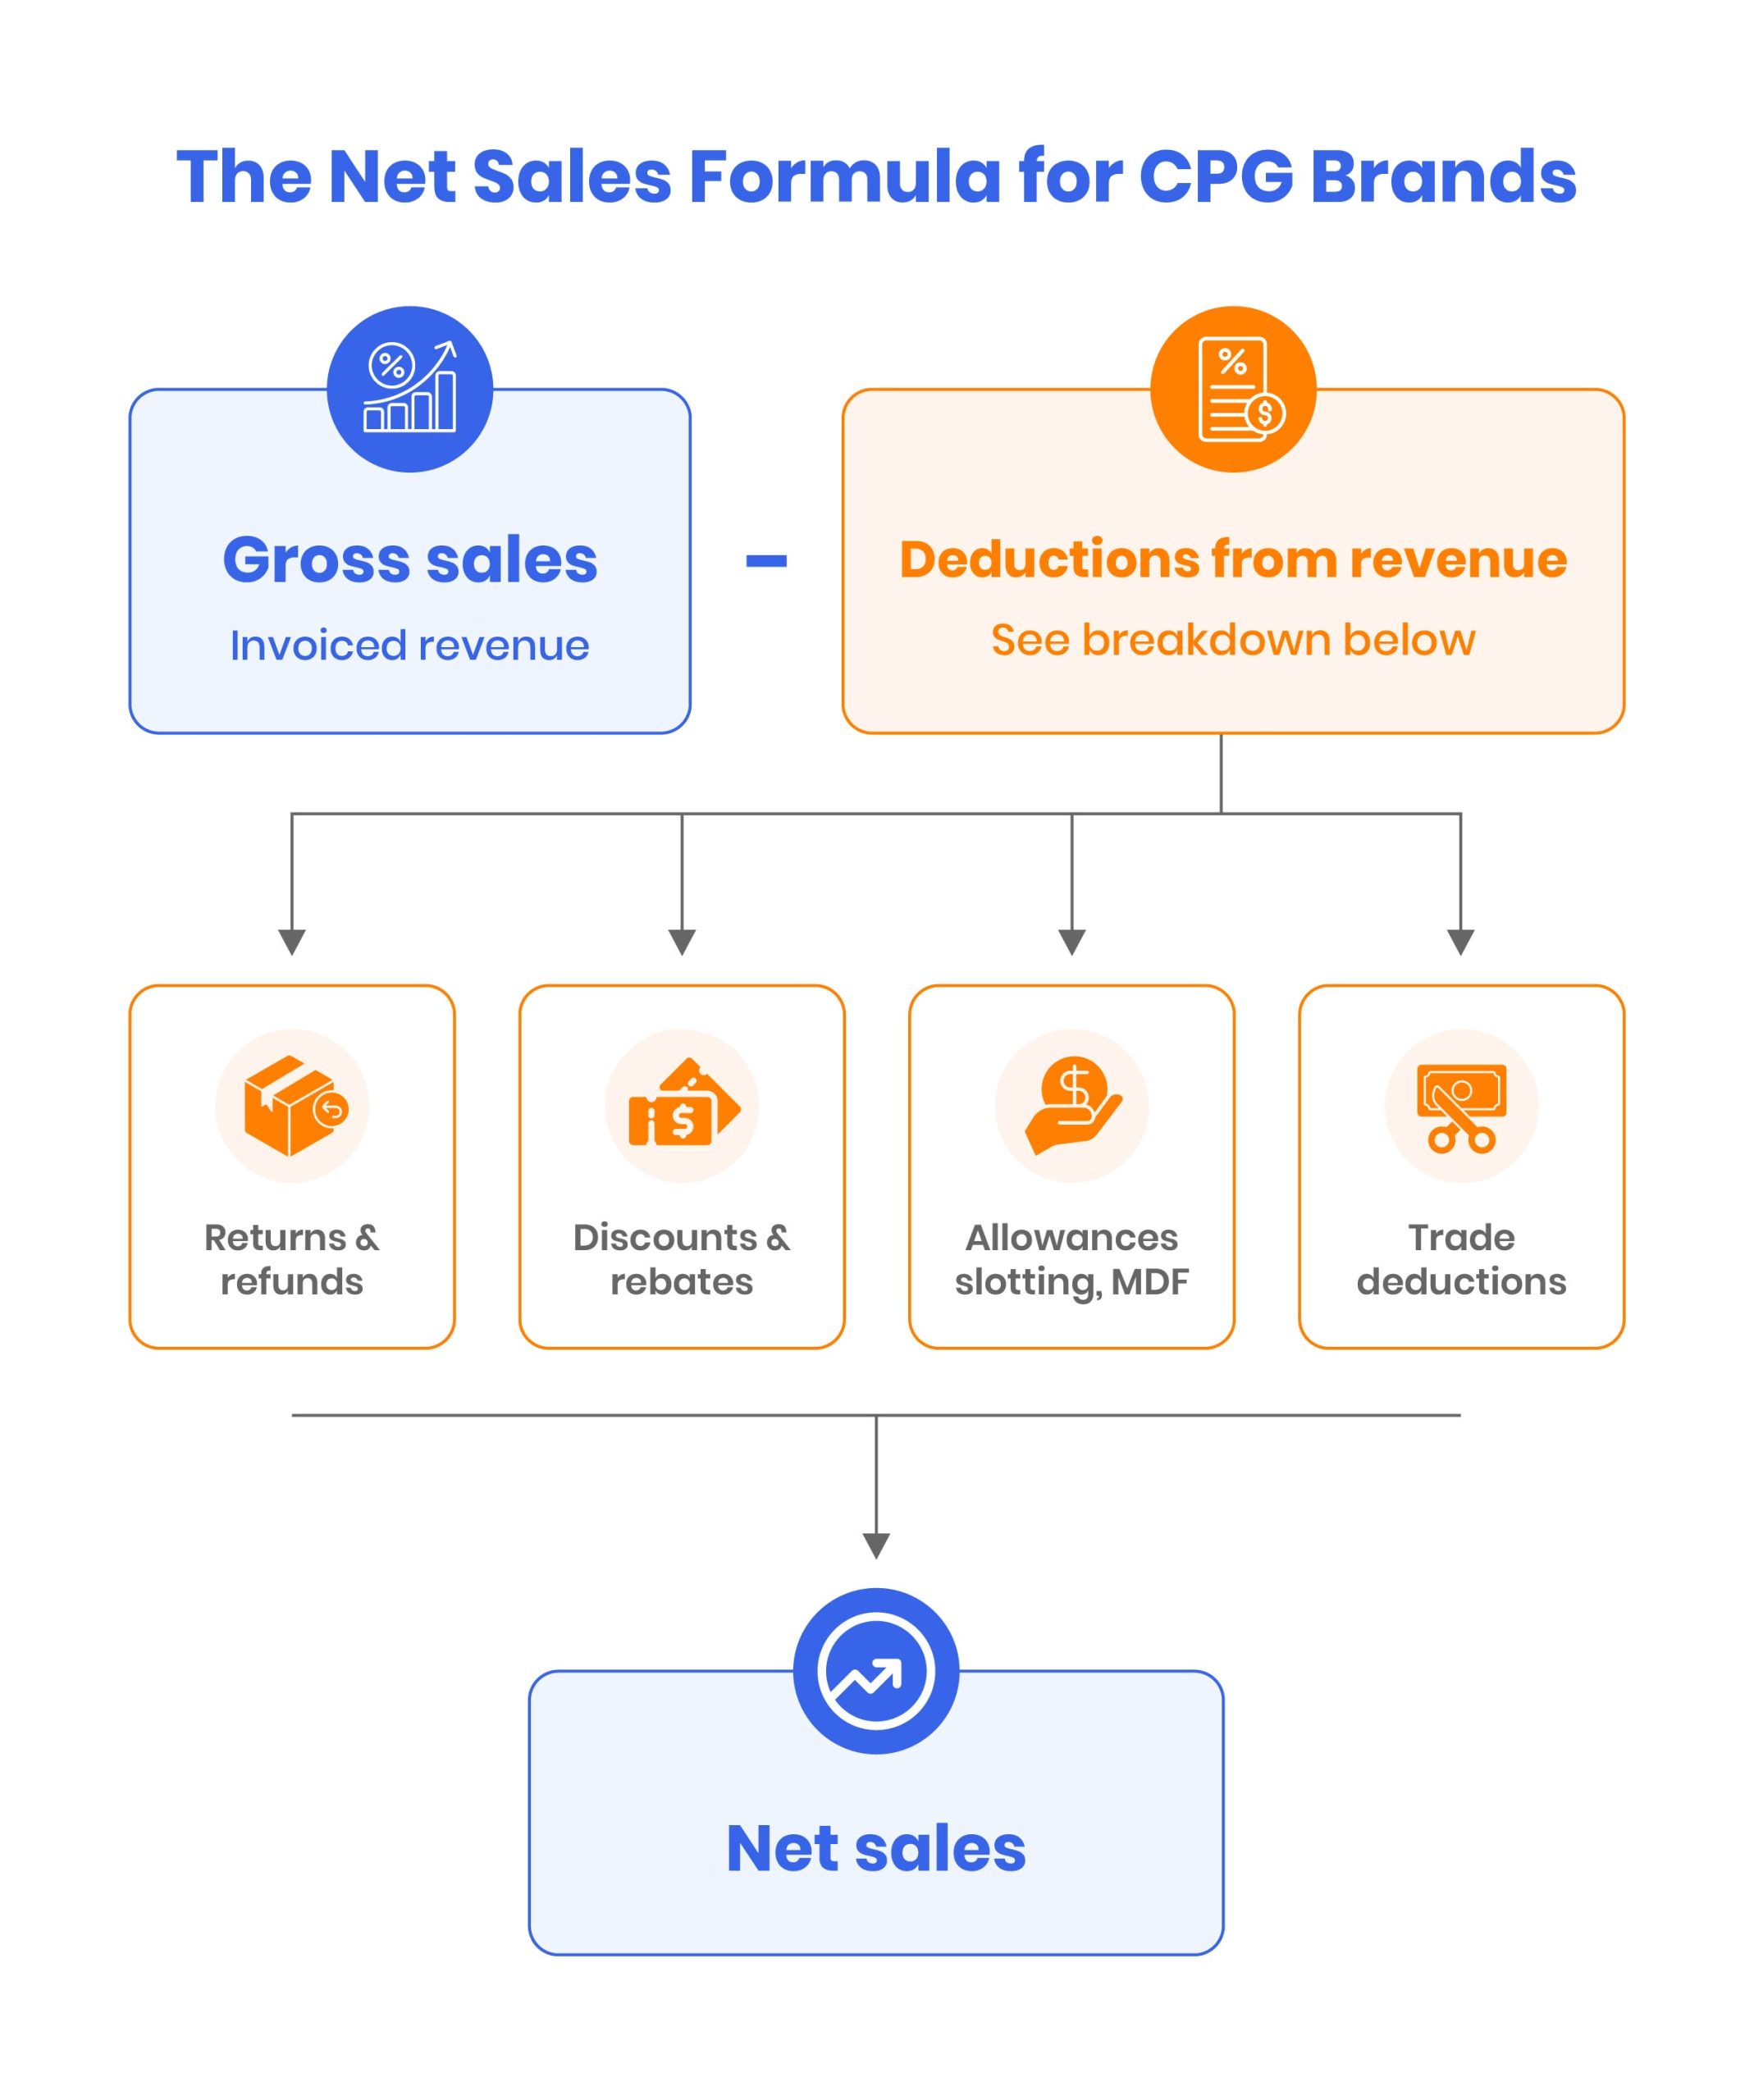
Net sales show revenue after discounts, returns, allowances, and deductions. CPG CFOs should track net sales by retailer, SKU, channel, and period. It is important as it shows the actual cash incoming rather than exaggerated invoice numbers.
The gross margin shows the percentage of revenue left after COGS. It helps CFOs identify product, channel, or retailer profitability issues.
Product-level margin helps CFOs find products that sell well but produce weak profit after product costs, freight, discounts, or trade spend.
Retailer profitability shows which customers produce profitable growth and which customers create deduction, chargebacks, or margin pressure.
Trade spend and deduction KPIs help consumer packaged goods management see whether promotions create profitable growth or revenue loss.
This KPI shows how much revenue is being invested toward promotions, discounts, allowances, and retailer programs.
Trade Spend as a % of Gross Sales
Trade Spend %=(Total Trade SpendGross Sales)×100
Trade Spend %=Total Trade SpendGross Sales×100Trade Spend % = (1,800,000 ÷ 10,000,000) × 100 = 18%
Improve trade spend, deduction, and promotions KPI tracking with CPG finance support.
Most CFOs can’t say with confidence which promotions made money, which makes trade spend hard to justify when the board asks.
Trade promotion ROI reveals which promotions created profitable growth and which only increased volume at the expense of margin.
Deduction rate shows how much revenue is reduced by retailer deductions, chargebacks, claims, and short pay. (Deductions includes short-pay on an invoice for a promo, damages, shortage, compliance fine, etc.).
Open deduction balance shows unresolved retailer claims. A rising balance can signal AR pressure and weak deduction management.
Open deduction balance is one of those numbers that tells you how healthy a CPG business is because it is actual cash that you have already lost but haven’t accepted it yet. When a retailer takes a deduction, they have kept your money. Until you either validate it as legitimate or dispute and recover it, that money is recorded on your AR aging.
A growing open deduction balance means cash is leaving faster than your team can chase it.
Promotion accrual accuracy compares estimated trade spend with actual retailer claims. It helps CFOs improve month-end reporting.
Inventory KPIs show how inventory affects margin, cash flow, and service levels.
Inventory turnover measures how often inventory is sold and replaced. Low turnover can show slow-moving SKUs or excess stock.
Inventory Turnover Formula
Inventory Turnover=Cost of Goods Sold (COGS)Average Inventory∗
Inventory Turnover=Cost of Goods Sold (COGS)Average Inventory∗Average Inventory\ = (Beginning Inventory + Ending Inventory) ÷ 2 *
For example, an inventory turnover of 6 means the company sold and replaced its average inventory six times during the period.
Higher turnover generally indicates more efficient inventory management services, while a lower turnover may signal excess or slow-moving inventory.
Days inventory outstanding show how long inventory stays before selling. Higher days can indicate working capital pressure.
Every extra day of inventory is cash locked up in raw materials, packaging, and finished goods. A brand doing $20M in COGS with 90 days of inventory has roughly $5M sitting in stock. Cut DIO to 60 days and you’ve freed $1.6M, without raising a dollar of outside capital. That’s often the cheapest funding round a CPG brand will ever do.
Slow-moving inventory identifies products that tie up cash and may require markdowns, write-downs, or demand planning review.
Stockout rate shows how often products are unavailable. Stockouts can reduce sales and weaken retailer relationships.
Inventory accuracy compares system inventory with actual stock. Poor accuracy can distort COGS, cash flow, and demand planning.
Cash flow KPIs show whether the business has enough liquidity to fund inventory, vendor payments, payroll, growth, and promotions.
Without sufficient cash flow, companies may struggle to replenish inventory, pay suppliers on time, fund promotions, or capitalize on growth opportunities.
Cash conversion cycle measures how many days it takes for a company to convert investments in inventory and other resources into cash from sales.
Cash conversion cycle can point your attention to what is helping or hindering your cash flow. A lower (or even negative) CCC is generally better because it means the business has efficient accounts receivable services that collects from customers on time and manages inventory relative to how long it takes to pay suppliers.
Formula:
Cash Conversion Cycle (CCC) = DIO + DSO − DPO
Where:
Operating cash flow shows cash generated from core business activity. It helps CFOs judge whether growth funds itself.
Working capital shows short-term financial health. CPG CFOs should connect working capital with inventory, AR, AP, and trade spend.
The reason CPG CFOs connect working capital to inventory, AR, AP, and trade spend specifically is that these four line items are working capital in a consumer brand.
Inventory determines how much cash is tied up on shelves. AR determines how fast retailers pay you. While AP denotes how long you can stretch suppliers while accrued trade spend is the invisible liability that either eats the AR (as deductions post) or hits cash. Move any one of them and the working capital number moves with it, which is why a fractional CFO watches all four together, not the total balance sheet.
A 13-week cash flow forecast turns short-term cash flow management into a working tool, helping CFOs see risks from vendor payments, inventory buys, deductions, and collections. It is also used by finance teams for quarterly planning and investor reporting.
The finance or accounting team typically maintains the forecast day-to-day, updating actuals, collections, payments, and other assumptions as they change.
The CFO or finance leader reviews it regularly to assess liquidity, spot risks, and make decisions around working capital.
Below is an example of a 13-week rolling cash forecast for a $15M CPG beverage brand:
AR and AP KPIs help CPG CFOs understand cash collection timing and vendor payment pressure.
DSO shows how long customers take to pay. Higher DSO can signal collection delays, deduction disputes, or retailer payment issues.
AR aging shows unpaid invoices by age. CFOs should review older balances and deduction-heavy customers.
DPO shows how long the company takes to pay vendors. CPG CFOs use DPO to balance supplier relationships and cash preservation.
AP aging shows upcoming supplier payments. It helps CFOs manage cash flow and payment timing.
Forecasting KPIs help CPG CFOs compare plans with actual performance. They turn the forecast from a static document into a working tool that shows where the business is drifting off plan and why.
Forecast accuracy shows how close sales, inventory, or cash forecasts were to actual results. It is usually measured as a percentage. The smaller the difference between forecast and actual, the higher the accuracy.
CPG CFOs track forecast accuracy for demand, production, and cash so they can identify which parts of the business are predictable and which need tighter controls.
Low accuracy in demand forecasts often points to weak retailer signals.
Forecast variance shows the difference between planned and actual performance. CFOs should review variance by SKU, retailer, channel, and promotion, because a single top-line number can hide offsetting misses.
A brand may hit its overall revenue forecast while missing badly on two key SKUs and overperforming a low-margin one, which changes the profit picture entirely. Reviewing variance at this level of detail is what turns a forecast into an early warning system
Budget vs actual reporting shows where spending, revenue, margin, or cash flow differs from plan.
For CPG brands, the most useful budget vs actual reviews go beyond department-level totals and break down performance by trade spend program, retailer, and SKU. This is where CFOs usually spot the first signs of margin loss, unplanned freight costs, or overspend on promotional support that did not lift sales.
Promotion forecast variance shows whether promotional demand, costs, and deductions matched expectations. It is one of the most important KPIs in consumer-packaged goods because promotions drive a large share of volume but also a large share of margin reduction.
Tracking promotion forecast variance by retailer and event helps CFOs decide which programs to repeat, renegotiate, or drop.
CPG CFOs use KPIs to find margin loss by comparing gross margin, trade spend, deductions, product profitability, and retailer performance.
Margin loss often appears when:
A brand may grow revenue year over year, but cash keeps getting tighter, and no one on the finance team can explain why. Usually, the answer is that a few products are carrying near-zero net contribution margin after freight, broker fees, and retail allowances, while price increases have lagged input cost increases by 12 to 18 months as shown in an example below:
Key Insights:
Sparkling water and functional energy together are $11.08M, that is 84% of revenue and the two products the sales team may celebrate every quarter. They are what growth may look like on the top line. But after 32% and 25% trade spend, 53% and 57% COGS, and heavy freight, they generate a combined $570K of contribution margin. That’s 5% on 84% of revenue.
Cold brew coffee is 16% of revenue but contributes $902K, that is 61% of the entire brand’s contribution margin.
The solution could be to reprice the sparkling water, renegotiate co-packer terms, and either restructure trade spend on functional energy or reduce the SKU count to free up more working capital for cold brew.
A financial KPI dashboard for CPG CFOs should show finance, sales, inventory, trade spend, and cash flow metrics in one decision-ready view. The goal must be to give leadership a fast read on where the business stands and where to look next.
A dashboard only creates value if it is reviewed on a consistent schedule. Use this simple cadence:
Weekly reviews catch cash and collection problems before they become crises
Monthly reviews connect operating decisions to reported financial results.
Quarterly reviews step back to evaluate retailer relationships, promotion strategy, and the accuracy of the forecasting process itself.
CPG brands need CFO-level KPI support when finance teams cannot explain margin changes, cash flow pressure, inventory risk, or trade spend performance. The tipping point is usually a growing gap between what leadership needs to know and what the current finance function can produce.
CPG brands that need SKU-level profitability, retailer margin analysis, trade spend visibility, rolling forecasts, inventory planning, and board-ready reporting can use CPG CFO services to turn financial KPIs into better decisions.
Signs include:
Any two or three of these together usually mean the brand has outgrown its current reporting setup and needs CFO-level attention to rebuild visibility.
The KPIs in this article are only useful if someone builds them, maintains them, and knows how to read them against the nuances of a CPG business. That’s the work Expertise Accelerated does for growing brands every day.
We are not a generalist finance team applying a standard playbook to a food-and-beverage or personal-care business. Our team works inside the specifics of co-packer contracts, retailer deduction reports, slotting and MCB accruals, cold-chain freight, and channel-level margin analysis, because those are the places CPG margin lives and dies.
Our CPG accounting services deliver monthly US GAAP financials on a reliable cadence, with variance analysis against prior month, prior year, and budget, so leadership can see what’s changing and why. From there, the work is organized around the KPIs that help CPG brands grow.
On the margin side, we manage trade promotions to close the material differences between accrued and actual spend and measure promotion ROI against incremental lift, so deduction loss stops compounding unseen. So there is more visibility in deduction losses.
On the working capital side, we build the AR rolling forecast, AP aging with critical-vendor visibility, and inventory reporting by lot code and expiry. The inputs behind are DSO, DPO, inventory days, and the cash conversion cycle.
On the forward-looking side, 13-week cash flow forecasts and full financial planning and analysis tie those KPIs to operating decisions, so the model is a tool the CEO and board can act on.
The result is what every CPG CFO is really after: numbers that arrive on time, hold up under board and lender scrutiny, and point clearly to where the next dollar of margin or cash is going to come from.
Need clearer KPI visibility across margin, inventory, trade spend, and cash flow?
Book a consultation with Expertise Accelerated to improve CPG financial reporting and CFO-level decision support.
Financial KPIs for CPG CFOs should connect a P&L line to a cash consequence. Looking at gross margin by SKU (not just at the brand level), trade spend as a percentage of gross sales, deduction rate by retailer, DSO, DPO, inventory turnover and slow-moving inventory, and the cash conversion cycle. Everything else is either a driver of these or a distraction from them.
KPIs help the CEO make decisions. They identify problems that are often not visible from the P&L. For instance, the SKU that is making money on paper but losing it after freight and deductions, the promotion that seems to have worked but destroyed margin, the retailer whose growth is costing you cash.
A brand can grow 20% year over year and still be 30 days from a cash crisis, and KPIs help identify that so that the problem can be addressed on time.
The following KPIs help CPG CFOs track trade spend and identify areas where they might be losing margins:
The following KPIs matter for CPG brands:
In CPG, inventory sitting in a 3PL is cash sitting on a pallet, so it is also a good idea to measure inventory outstanding tied to the cash conversion cycle.
Inventory KPIs may also reveal which SKUs have to be removed.
In CPG, cash swings hundreds of thousands of dollars in a week depending on when co-packer invoices land, when trade spends true ups hit, and when a big chain finally pays.
CPG CFOs watch a 13-week rolling cash forecast and days of cash on hand, headroom against any minimum cash covenant, DSO by retailer, and net cash from operations to track cash flow.
Finance teams should be able to tell you what the bank balance will be six weeks from now within a reasonable range.
Here are some of the signs when a CPG brand need CFO-level KPI reporting:
One sign is enough to act on. Most founders wait until they see two or three at once, and by then the damage is about six months old.